Background and metadata
Overview
Teaching: 15 min
Exercises: minLearning Objectives
Understand the data set
What is hypermutability?
The experiment
The data we are going to use is part of a long-term evolution experiment led by Richard Lenski.
The experiment was designed to assess adaptation in E. coli . Twelve populations of E. coli strain REL606 were propagated for more than 40,000 generations in a glucose-limited minimal medium (in most conditions glucose is the best carbon source for E. coli, providing faster growth than other sugars). This medium was supplemented with citrate, which E. coli cannot metabolize in the aerobic conditions of the experiment. Sequencing of the populations at regular time points revealed that spontaneous citrate-using variant (Cit+) appeared between 31,000 and 31,500 generations of the Ara-3 population. in the causing an increase in population size and diversity. In addition, this experiment showed hypermutability in some populations. Hypermutability is important and can help accelerate adaptation to novel environments, but also can be selected against in well-adapted populations.
To see a timeline of the experiment to date, check out this figure, and this paper Blount et al. 2008: Historical contingency and the evolution of a key innovation in an experimental population of Escherichia coli.
The data
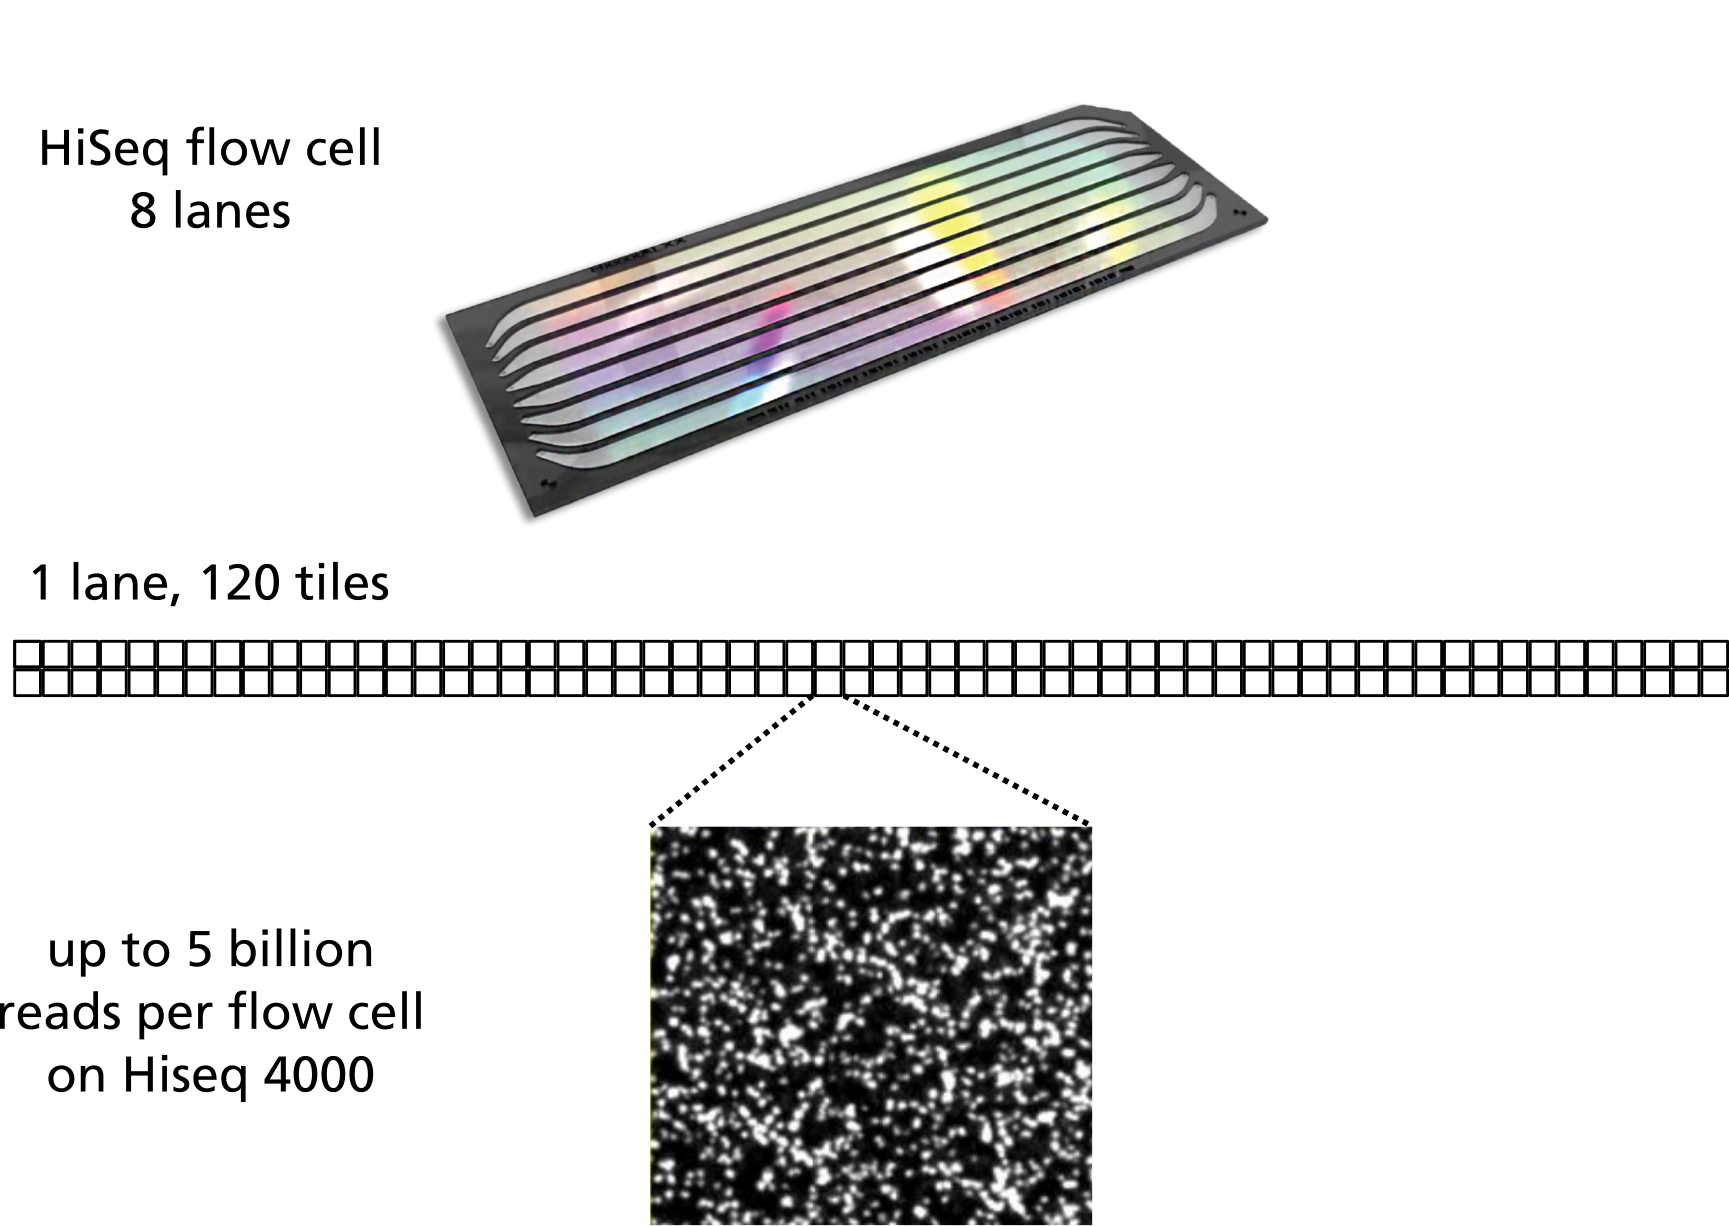
The sequencing data is from Illumina sequencers, which use flow cells, which are divited into lanes, which are divided into tiles. The FASTQ files we will use later has information on the lanes, tiles, and positions. It’s useful to be familiar with the general organisation of the data, as shown below (the exact number and layout of tiles per lane varies for different flow cells):

The metadata
We will be working with three sample events from the Ara-3 strain of this experiment, one from 5,000 generations, one from 15,000 generations, and one from 50,000 generations. The population changed substantially during the course of the experiment, and we will be exploring how (the evolution of a Cit+ mutant and hypermutability) with our variant calling workflow. The metadata file associated with this lesson can be downloaded directly here or viewed in Github. If you would like to know details of how the file was created, you can look at some notes and sources here.
This metadata describes information on the Ara-3 clones and the columns represent:
| Column | Description |
|---|---|
| strain | strain name |
| generation | generation when sample frozen |
| clade | based on parsimony-based tree |
| reference | study the samples were originally sequenced for |
| population | ancestral population group |
| mutator | hypermutability mutant status |
| facility | facility samples were sequenced at |
| run | Sequence read archive sample ID |
| read_type | library type of reads |
| read_length | length of reads in sample |
| sequencing_depth | depth of sequencing |
| cit | citrate-using mutant status |
Challenge
Based on the metadata, can you answer the following questions?
- How many different generations exist in the data?
- How many rows and how many columns are in this data?
- How many citrate+ mutants have been recorded in Ara-3?
- How many hypermutable mutants have been recorded in Ara-3?
Solution
We will address the metadata questions in R
library(tidyverse)── Attaching packages ────────────────────────────────── tidyverse 1.2.1 ──✔ ggplot2 3.1.0 ✔ purrr 0.3.0 ✔ tibble 2.0.1 ✔ dplyr 0.7.8 ✔ tidyr 0.8.2 ✔ stringr 1.4.0 ✔ readr 1.3.1 ✔ forcats 0.3.0── Conflicts ───────────────────────────────────── tidyverse_conflicts() ── ✖ dplyr::filter() masks stats::filter() ✖ dplyr::lag() masks stats::lag()metadata <- read_csv("https://raw.githubusercontent.com/data-lessons/wrangling-genomics/gh-pages/files/Ecoli_metadata_composite.csv")Parsed with column specification: cols( strain = col_character(), generation = col_double(), clade = col_character(), reference = col_character(), population = col_character(), mutator = col_character(), facility = col_character(), run = col_character(), read_type = col_character(), read_length = col_double(), sequencing_depth = col_double(), cit = col_character() )# generations length(unique(metadata$generation))[1] 25# rows and columns list(rows=nrow(metadata),cols=ncol(metadata))$rows [1] 62 $cols [1] 12# citrate+ table(metadata$cit)minus plus unknown 12 10 39# hypermutable table(metadata$mutator)None plus 48 6# are hypermutators only in cit+ mutants? table(metadata$mutator,metadata$cit)minus plus unknown None 11 5 32 plus 1 5 0