Getting started with R and RStudio
Overview
Teaching: 15 min
Exercises: 5 minLearning Objectives
Understand and describe two ways of using R interactively: The R console and RStudio
Be able to create an R script in RStudio and send R commands to the R console
Be able to use the basic R help system in R and RStudio
What is R?
R is a high-level programming language that is extensively used by statisticians and bioinformaticians. While R is a general purpose programming language, R is designed to work with data, and is heavily used in the data science community.
Additionally, R is an interpreted language, which means that code written in R will be executed by a command interpreter instead of requiring compilation (as is the case with compiled languages such as C or Java). Interpreted languages are especially convenient for real-time problem solving and rapid prototyping.
Use of R has increased substantially over the last few years in large part due to the growth in data intensive fields and data science. Hence, knowing how to work in R is becoming increasingly important, and will be the main language we will work in for analysis of genomic data.
R features
Various features of R makes it attractive for data analysis. These includes the following:
- R is open-source, which means both that algorithms and methods can be checked for validity, and that users of R contribute to the code base and development of new packages.
- R runs on all major computer platforms.
- R can be extended using packages.
- R is free software (as in free speech, not free beer), available under the [GNU General Public License][GPL] version 2 or greater. R packages may be distributed under different license terms.
- R has outstanding graphics and data visualisation capabilities, supporting publication quality graphs/figures.
- R has an active community of users and developers, which facilitates the ease of getting help from others.
Disadvantages of R
Life is full of tradeoffs, and not everything about R is an unambiguous advantage over other choices.
- Code written in R runs much slower than code written in C or Java. (However, writing code usually takes much longer than running it, so this is often not a concern).
- R has a somewhat quirky language syntax, and is sometimes seen as an inconsistent language. R is often accused of violating the Principle of Least Astonishment.
The R Console
One way to run R is inside bash. Try running R from either an open shell window (type R) or from the window launcher. In either case, you should wind up at a console window that looks something like this:
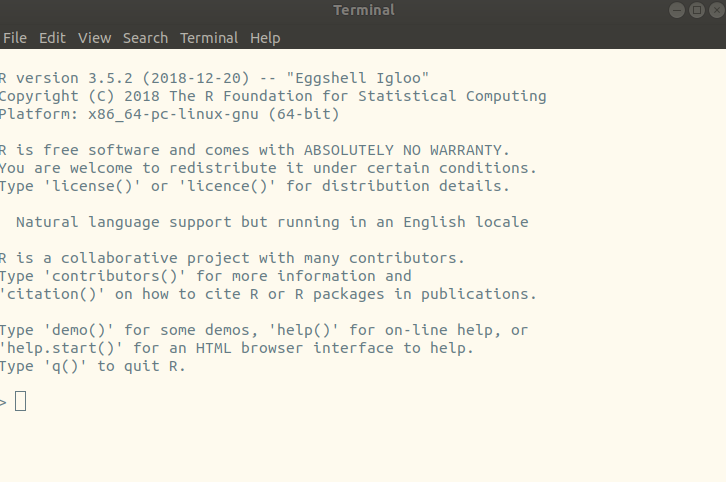
The R Console is your basic R interface, provided by the language itself. There is a prompt, but it’s no longer the bash prompt $ , it’s the R prompt > . When R starts, it tells you what version of the R program is running and what kind of hardware you are using to run it.
R can be used as a fancy calculator: you can get output just by typing some math at the console, like this:
# This is some R input. A line that begins with # is a comment
# 22/7 is pretty close to pi, but it's not pi!
22/7
[1] 3.142857
# it's silly to estimate the value of pi as a fraction; R already defines a value for pi
pi
[1] 3.141593
In these episodes, we can distinguish the input (what you type at the console) from what the R language returns by the color coding on the left.
you can perform a lot of actions at the prompt. Try this, and see a plot similar to what is shown below
x <- rnorm(1000)
hist(x)

-
The first line generates 1000 random data points sampled from a normal (Gaussian) distribution with mean 0 and standard deviation 1. This data is then assigned to a variable
xwith the assignment operator<-. (Many other languages use=for assignment, which works in R, but there are good reasons to use<-. -
The second line plots a histogram of
x. If you use the R console, the plot will open up in a separate window.
RStudio
R is the language and interpreter, whereas [RStudio][rstudio] is a professional development environment that includes a code editor, debugging tools, and a server available from a browser. A screenshot of the RStudio interface is shown below. We encourage the use of RStudio as an interface to R.
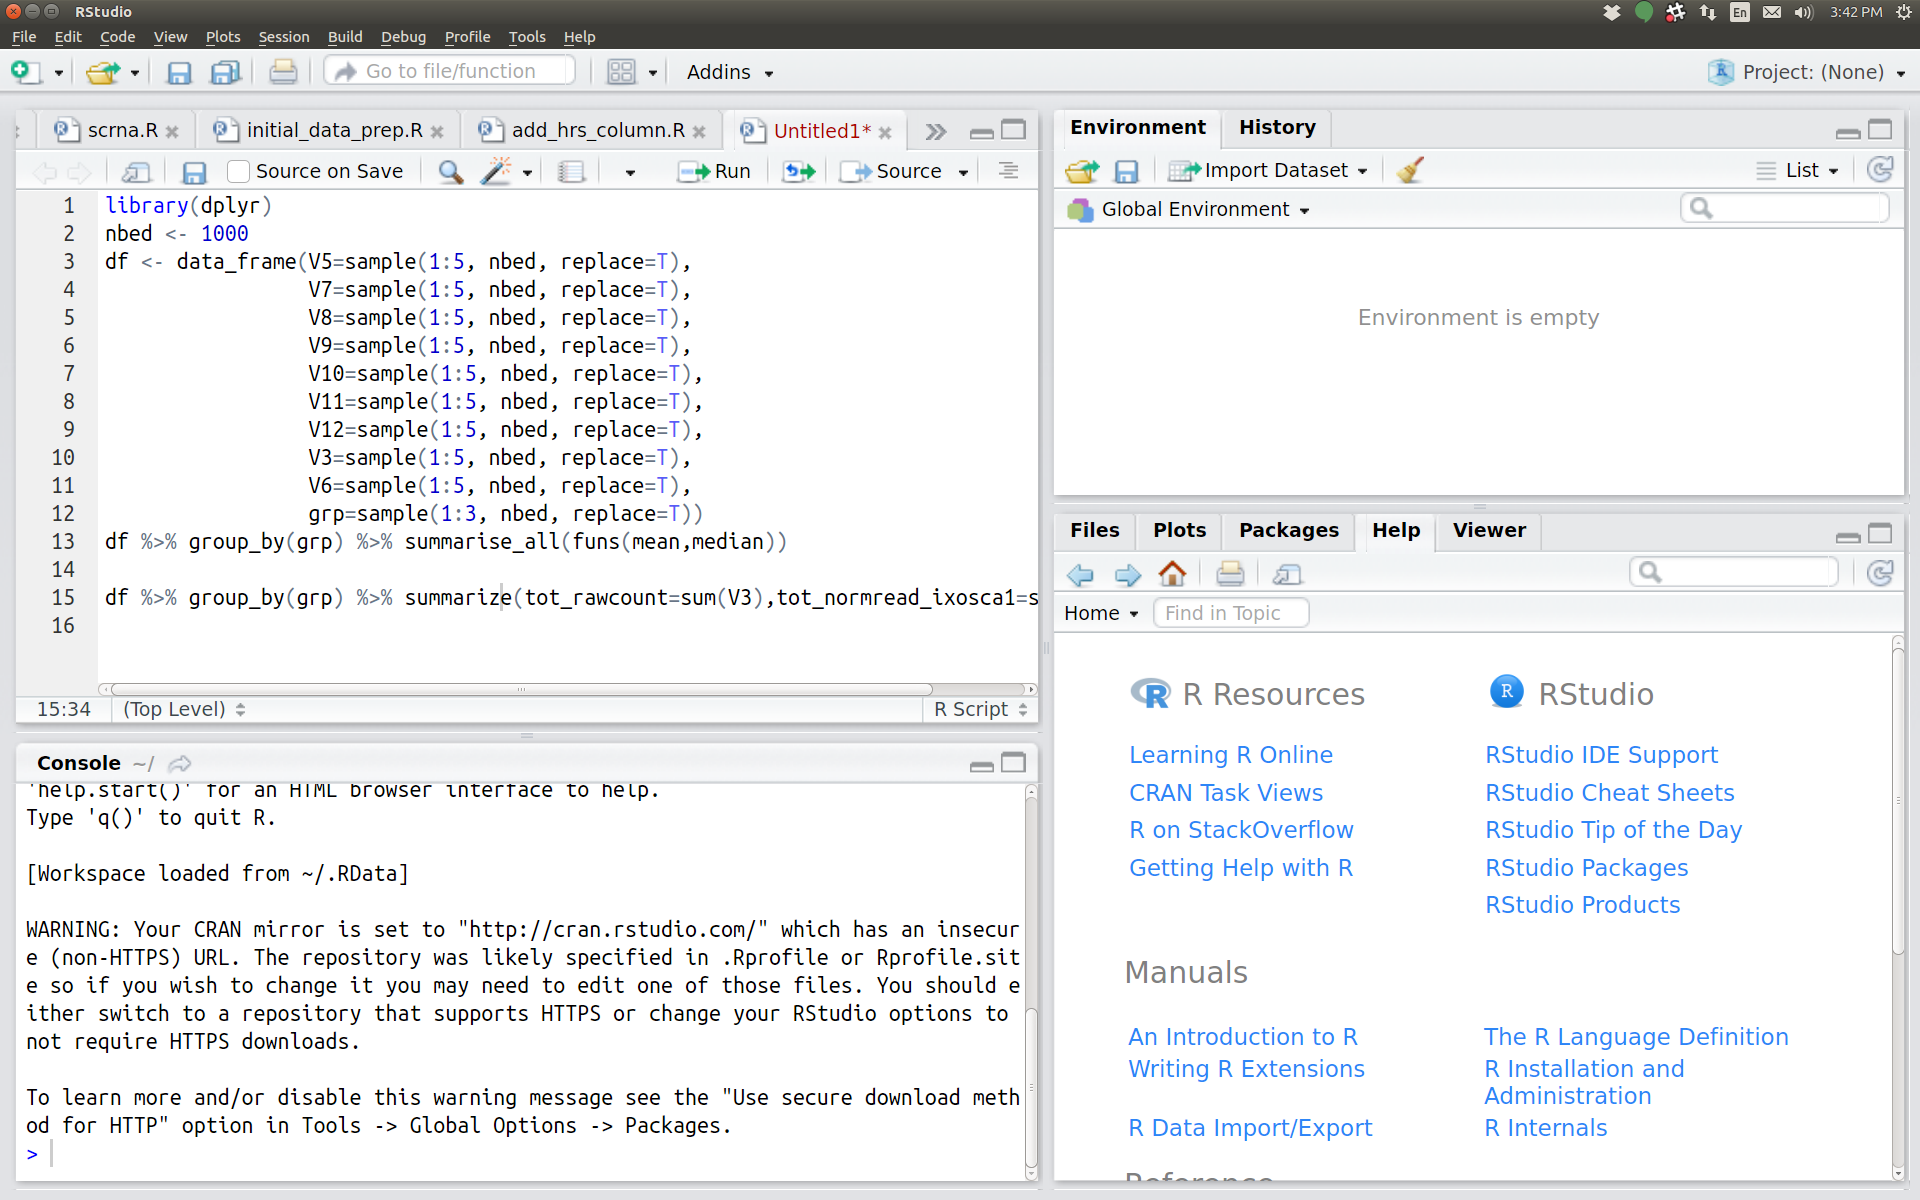
In RStudio, the console, graphics, help windows, scripts, and a data explorer tool are all integrated into one graphical interface.
Try it!
Run the following in the R Console window in RStudio:
x <- rnorm(1000)
hist(x)
You can type R commands just like at the bash command line: each time you hit Enter you will send a command to the R interpreter.
What happens?
Solution
- You may notice that when you type ( RStudio automatically adds the ) and positions the cursor appropriately.
- Your plot will open up in a subwindow on the right, not a new window as it would if you were using the console.
R’s help system
-
Functions like
rnormcan perform a lot of activities depending on their parameters. To get help on any R function, type?namefor the function name. For example, if you want to find out about the normal distribution functions likernorm, type?rnorm. Try that now. -
If you are unsure of the function you are looking for, try
??nameon a function to get a list of possibilities. -
Weirdly enough, even operators like
+and?are really functions in R, but to get help you need to enclose them in backticks. Try?`+` -
R’s help system is extensive, and we’ve just scratched the surface of what it can do.
Changing the sample distribution
Using RStudio, create a new R script. Enter code into the script to create a few lines of R code to sample a normal distribution with mean 100 and standard deviation 5 (hint: use
?rnormto figure this out), and plot a histogram of the results. Use Ctrl-Enter to send each line from the script editor to the console.Solution
Let’s sample a large number of points to get a good smooth distribution.
x <- rnorm(n=10000,mean=100,sd=5)
hist(x)

Our last preparation step before moving on
- Using RStudio, create a New Project (File -> New Project) in a new directory (I suggest the Desktop). Call the project whatever you want.
- Under the Files tab on the right (!), create a new folder called “data”. We will use this later in the session.
Key Points
R is a general purpose programming language; both the R console and RStudio are interfaces to R
RStudio has features that help R users control and document their activities.
The RStudio script editor allows users to send code line by line to the console using Control-Enter
R has an extensive help system.